- solutions
- advanced analytics
What 2020 Corporate Meal Spend Can Tell Us About Traveler Behavior During The Pandemic
Emburse Data Dive
What 2020 Corporate Meal Spend Can Tell Us About Traveler Behavior During The Pandemic
From November 19, 2020
It’s no secret that the travel industry has seen air and hotel volumes reach an all-time low this year. But does that mean in-person meetings and business trips haven’t been happening at all?
Breaking down the numbers
225%
Increase in April meal spend year over year
150%
Increase in car spend as a share of total air spend
71%
Increase in the total number of meals expensed from the second quarter of 2020 to the third quarter
98%
Percentage of car spend from the month of April to present
To examine this question, we looked to a new spend category: meals. For our latest Data Dive, we dug into the numbers to see how corporate meal spend is trending and what potential conclusions can be drawn about employee behavior amid COVID-19.
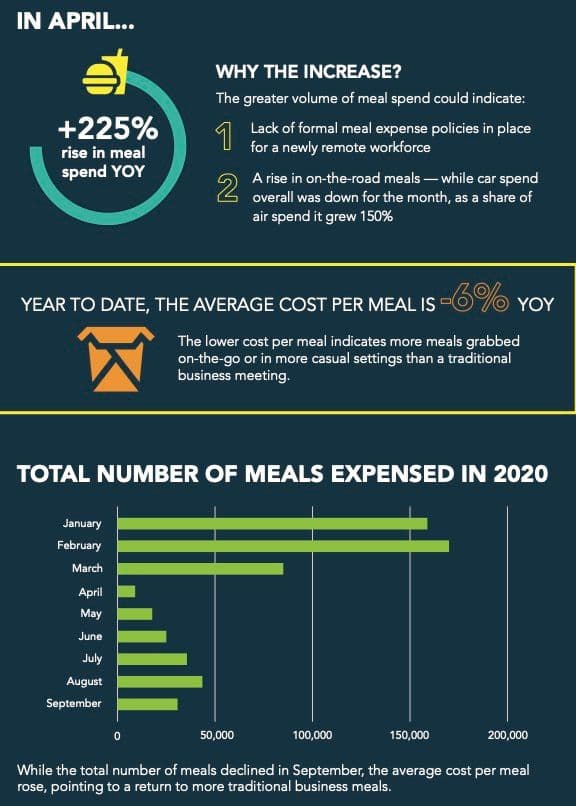
In April meal spend spiked 225% year over year, according to data from 15 Emburse Analytics Pro Travel clients from around the globe. This increase could indicate a lack of clarity or control over expense policy as many businesses transitioned to a remote environment.
There are other behavioral indicators present during that first full month of COVID-19 restrictions that could have contributed to the rise in meal spend. Namely, while there was an overall dropoff in car spend (which includes rental car and mileage reimbursement expenses) for the month of April, car spend as a share of total air spend actually increased 150% year over year. This combined with the meal spend data suggests employees who did carry on with business trips did so by switching out air travel for car travel and were, perhaps, grabbing more meals amid long road trips.
During the second quarter, as restrictions tightened, total meal spend and the number of meals expensed plummeted 84% and 82%, respectively. Car spend also declined in Q2, dropping 82% year over year.
From the second quarter of 2020 to the third quarter, owing in large part to the drop-off in Q2, we saw a 71% increase in the total number of meals expensed. That’s compared to a 12% decrease in the number of meals over the same period in 2019.
At the same time, average cost per meal year to date has declined 6% from 2019 (this dropoff is skewed slightly by pre-pandemic January and February data). The lower cost per meal once more suggests employees are driving instead of flying to meet colleagues, partners or clients. That’s because the meal an employee might grab on the road is likely to be lower in price than one they grab in a restaurant.
September data shows an increase in the average cost per meal, pointing to a return to more traditional business meals, as opposed to those grabbed on the go. From the month of April to today, car spend is still 98% of air spend and the rebound in car spend between Q2 and Q3, up 44%, also indicates a rebound in travel.
Want to access your T&E data?
Want to know more about tracking and analyzing meal spend within your organization? Contact us to dive into your T&E data.
Get started with Emburse Analytics Pro Travel
Welcome to Emburse Analytics Pro Travel, where we turn our focus to a particular trend or industry development to let the data tell the story.