


Nearly half of eligible enterprise customers now meet the AI adoption threshold, but wide regional differences in spend per customer and a top-heavy spend curve show why finance teams should match oversight to the size and frequency of AI purchases.
In July 2026, 49.1% of eligible enterprise customers met the Emburse AI Index adoption threshold, up 9.5 percentage points from a year earlier.
At first glance, those adoption figures suggest AI is becoming common across the customer base. The spending data tells a more uneven story. Canada and the United States posted similar adoption rates, but U.S. AI spend per eligible customer was roughly twice Canada’s. Across the full customer base, the highest-spending decile accounted for 81.2% of trailing-year AI spend. Finance leaders now face a practical governance challenge: broad adoption spans very different levels of investment. This is where Expense Intelligence comes in: it gives finance the same financial control over AI spend it expects everywhere else.
The data at a glance
- Adoption is approaching the halfway mark and still rising. 568 of 1,156 eligible enterprise customers had adopted AI by July 2026, up 9.5 percentage points year over year.
- Adoption varies by region. Adoption reached 52.9% in Canada, 51.2% in the United States, and 32.6% in Europe.
- Spend per eligible customer varies sharply. U.S. AI spend per eligible customer was $6,014, compared with $3,490 in Europe and $2,971 in Canada.
- Spend remains top-heavy. The top 10 customers represented 47.2% of trailing-year AI spend, while the highest-spending decile represented 81.2%.
How do adoption and spending differ by region?
Canada and the United States both crossed 50% adoption in July, but their spending levels differed substantially. AI spend per eligible customer was about $6,014 in the United States and $2,971 in Canada. Europe had lower adoption at 32.6%, while its $3,490 in spend per eligible customer was higher than Canada’s.
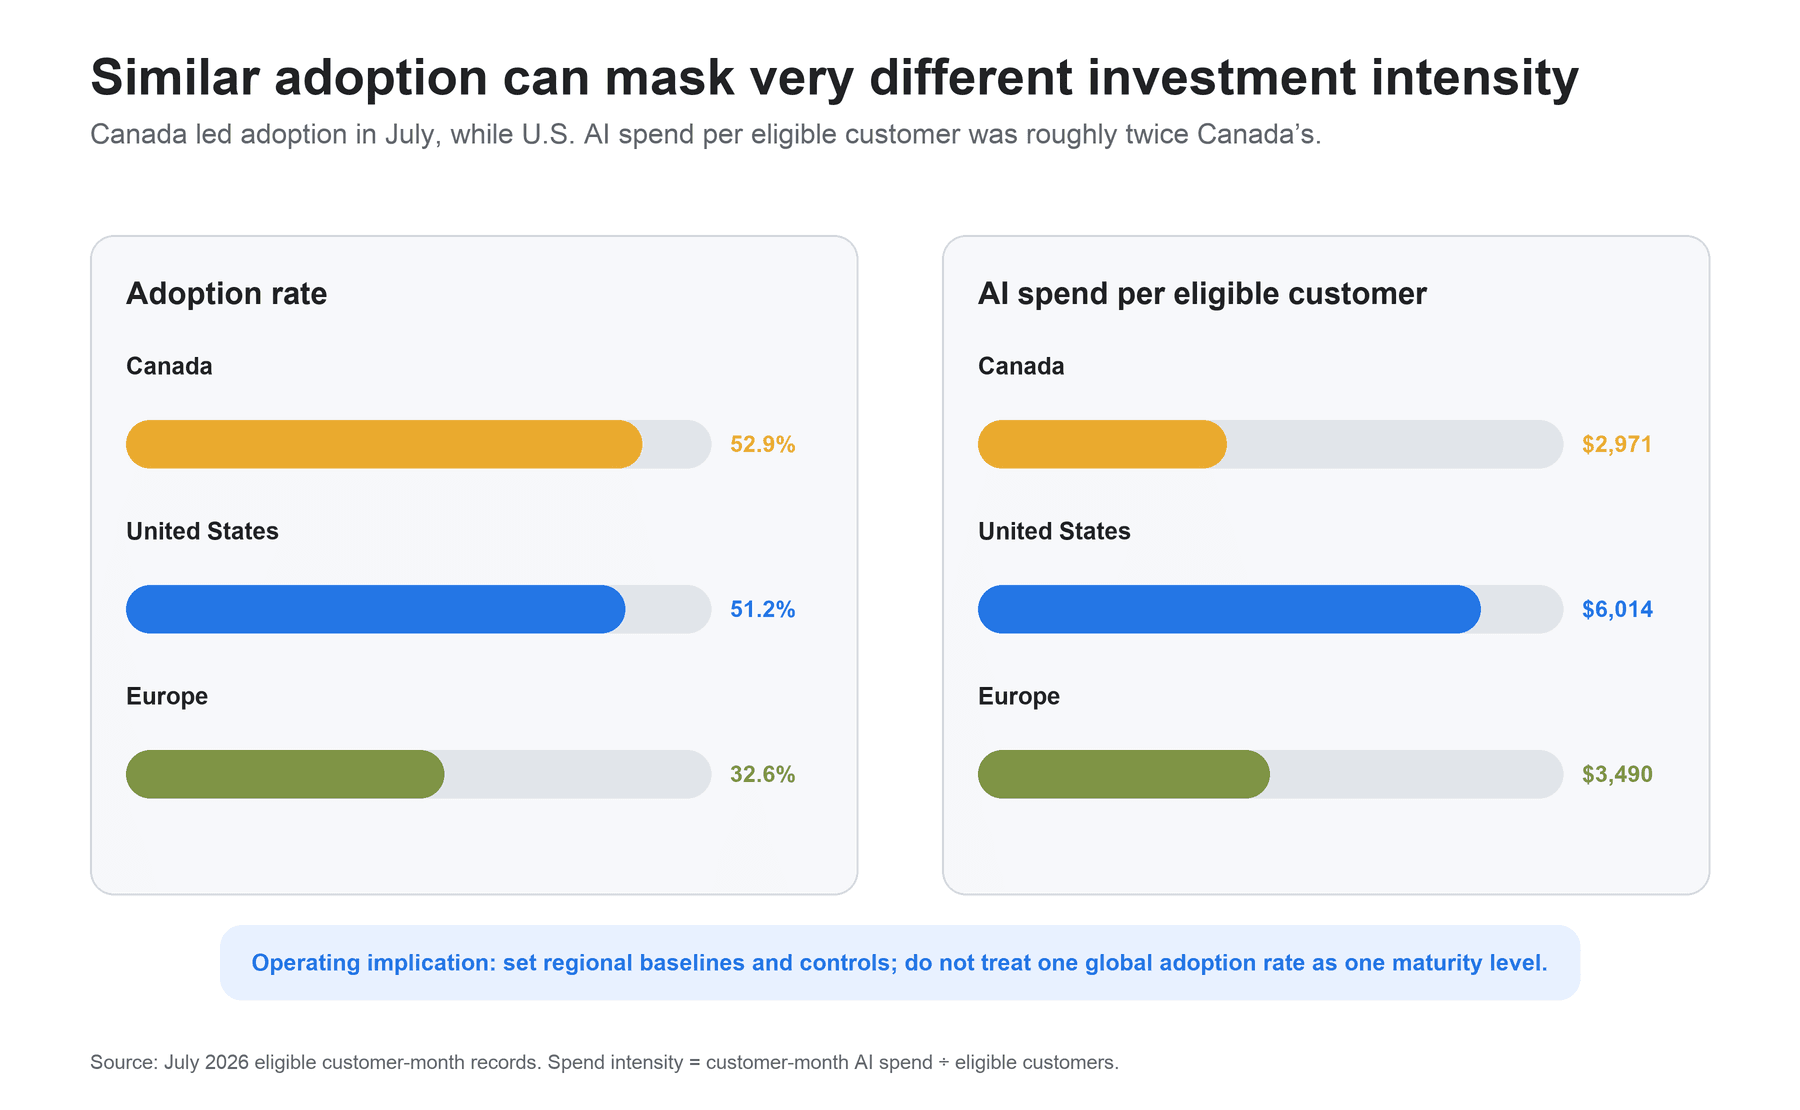
Figure 1. July 2026 adoption and AI spend per eligible customer by region.
Those figures make one global benchmark misleading. Where adoption is broad but spend per customer is lower, finance can focus on which uses are worth continuing and how results will be measured. Where spend per customer is higher, the more pressing questions are who owns it and how renewals are reviewed. Lower-adoption regions may first need help identifying useful applications and measuring early results.
Who accounts for most AI spend?
More customers are meeting the adoption threshold, while most AI spend remains concentrated among a smaller group. Across the trailing 12 months, the 10 largest spenders generated 47.2% of AI spend. The highest-spending decile—101 of 1,008 eligible customers with positive AI spend—generated 81.2%.
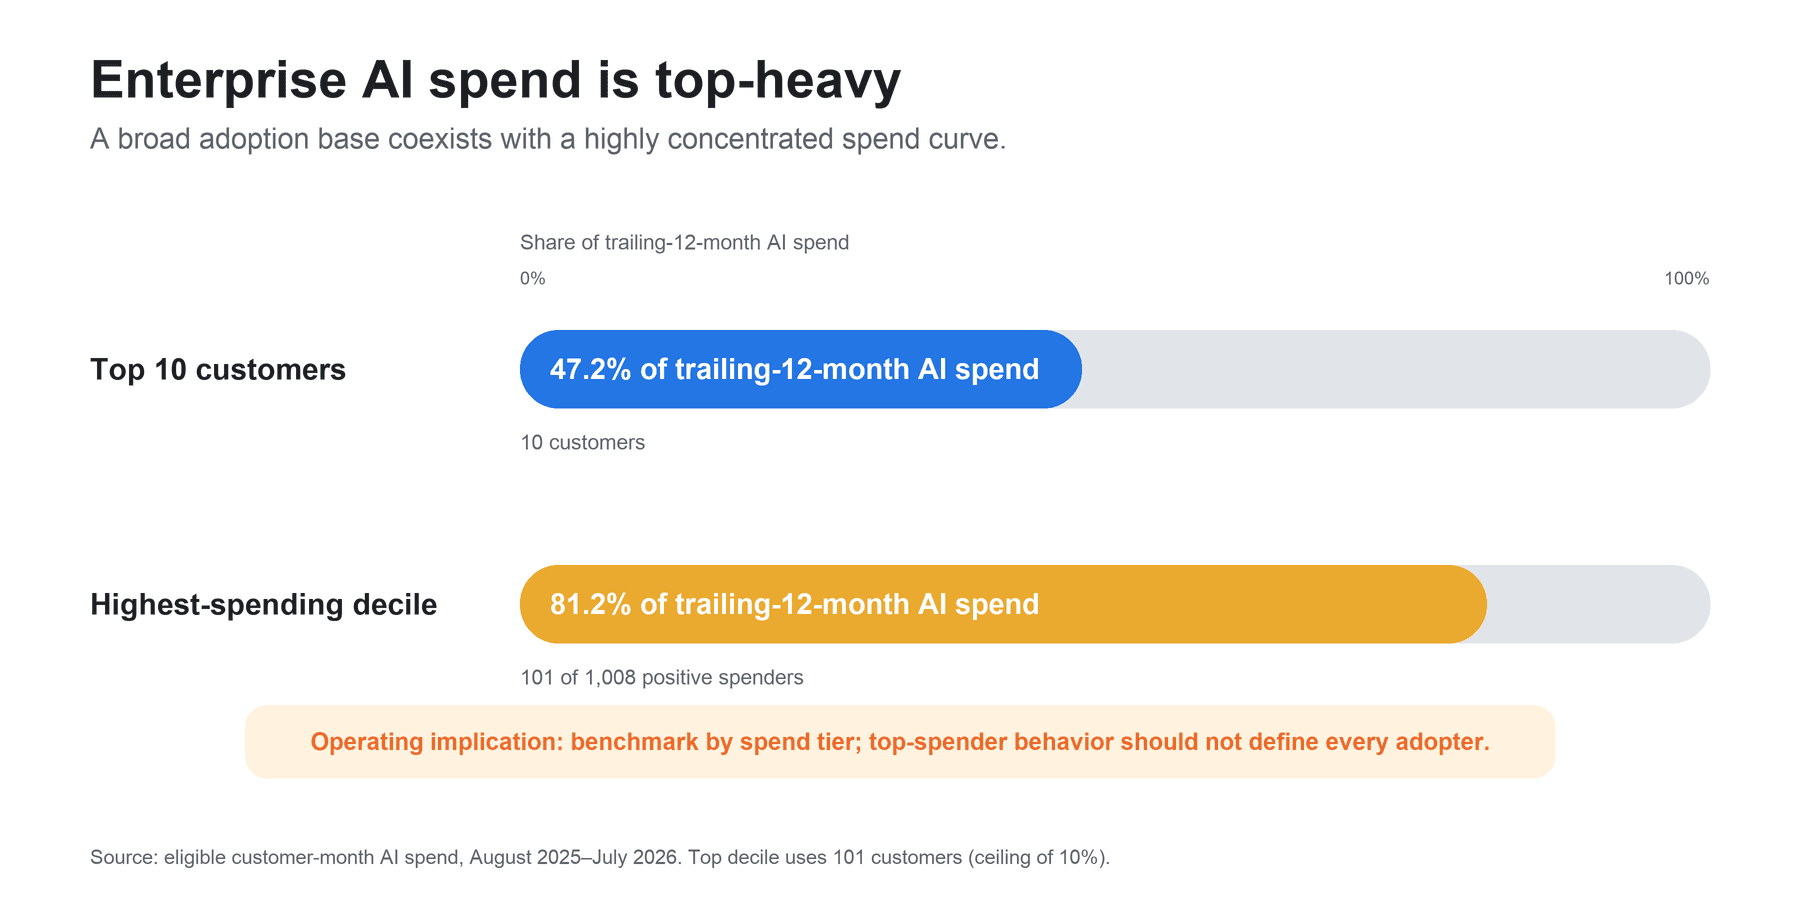
Figure 2. Concentration of eligible-customer AI spend, August 2025 through July 2026.
Taken together, these figures make the adoption rate easier to interpret. AI purchasing is widespread, yet a relatively small set of customers accounts for most of the dollars. A market average can accurately describe the category and still overstate what a typical adopter spends.
How should finance teams respond?
As AI spending becomes more common, finance teams need to distinguish one-off experiments from recurring spend tied to important work. Larger or more regular commitments warrant clearer ownership, evidence of value, and closer renewal review.
Finance teams can start by tracking adoption and spend per eligible customer separately, comparing regions and customers with similar patterns, and connecting recurring spend to a workflow, owner, and measurable outcome.
| Decision area | Recommended action | Why it matters |
|---|---|---|
| Measure | Track adoption and spend per eligible customer separately. | An adoption rate does not show how much customers spend. |
| Segment | Compare regions and business units with similar adoption and spend patterns. | Similar adoption rates can coincide with very different spending levels. |
| Govern | Require a named owner and periodic review for recurring or high-spend AI expenses. | Recurring charges can continue without an explicit purpose or renewal decision. |
| Prove value | Tie material AI spend to a stated use and measurable outcome. | Expense evidence shows spend, not productivity or ROI. |
What finance leaders should take from the data?
With nearly half of eligible customers now meeting the adoption threshold, AI spend is no longer a fringe category. The wide differences by region and customer also make a single policy a poor fit.
A one-off purchase and a recurring charge should not go through the same review. Finance can keep controls light for small pilots, then add a named owner, renewal review, approval thresholds, and evidence of a business outcome as spend becomes recurring or material. Higher-cost tools that support critical workflows may also need closer security and continuity review. The goal is to notice when a trial has become an operating commitment and manage it accordingly. Expense Intelligence supports that work by bringing fast-moving spend into view and under control.
This analysis is only possible because Emburse sees AI spend as it happens across expense, invoice, and card data—the financial visibility and control finance teams need as experimental purchases become recurring business tools.
Frequently asked questions
- What share of eligible enterprise customers has adopted AI? 49.1% had adopted AI by July 2026, or 568 of 1,156 eligible customers. That was up from 39.6% in July 2025.
- Does adoption mean an AI tool is active in production? No. The adoption measure is based on sustained AI-tagged expense activity. It does not prove active users, technical integration, productivity, security posture, or return on investment.
- How should finance teams govern AI spend? Start with two views: who has adopted and how much they spend. Apply closer review to large or recurring expenses, with someone accountable for the spend and a clear way to judge its value.