

A 2% hotel rate forecast can be exactly right, and still lead a travel program to the wrong conclusion.
CoStar and Tourism Economics forecast 2% growth in U.S. hotel average daily rates for 2026. That is useful market context for hotel RFP season. But it is not the same as a company’s hotel budget outlook.
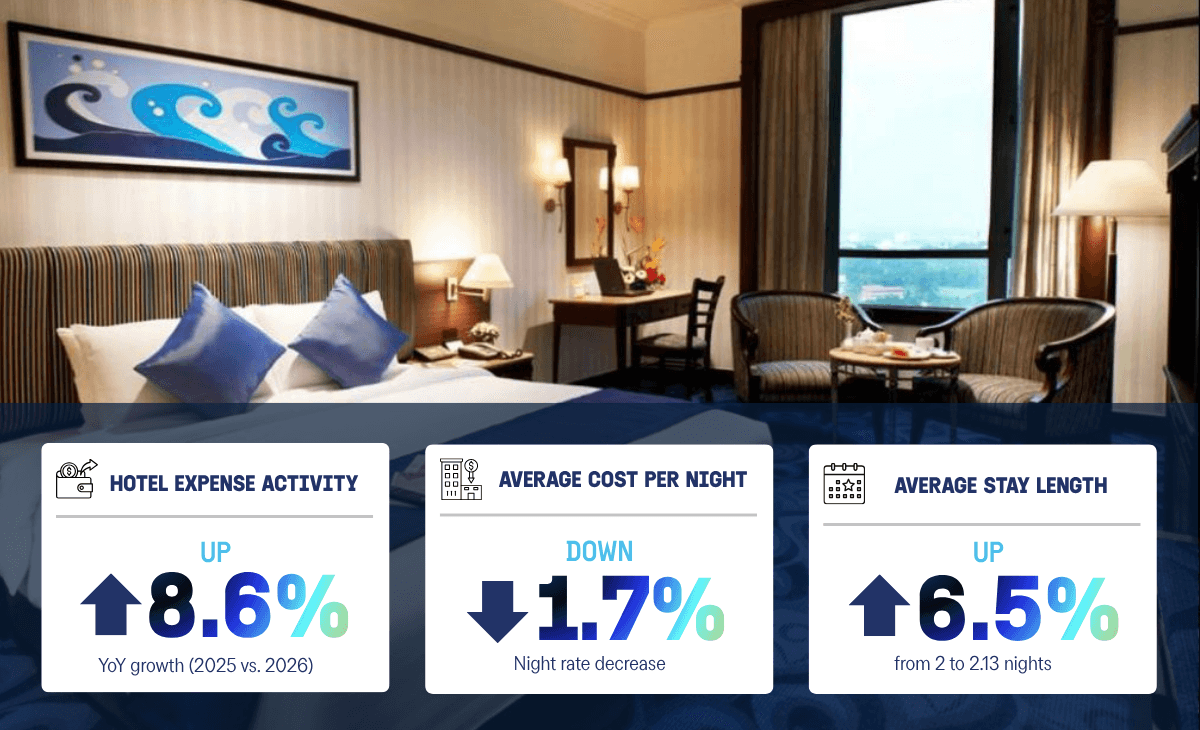
Across the 10 highest-volume cities in Emburse’s fixed cohort of 586 customer organizations, recorded lodging nights increased 16.6% in the first half of 2026, from 51,451 to 59,995. Positive U.S. dollar lodging expense rose 15.3%, from $14.50 million to $16.72 million.
At the same time, weighted expense per recorded night declined 1.2%.
That is the “so what” for travel, procurement and finance leaders. Hotel budgets do not move on rate alone. They move when travel activity changes, when trips concentrate in different markets and when the balance between volume and expense shifts. A lower expense per recorded night can still coincide with a meaningfully higher hotel bill.
The market forecast describes the environment suppliers are operating in. Your own demand pattern shows what is moving the travel budget, and where a sourcing, policy or planning response will matter.
The city-level data that follows puts that into focus. From January 1, 2025 through September 18, 2026, the 10 selected cities accounted for 180,806 recorded lodging nights, 82,407 qualifying expense records and $51.14 million in positive U.S. dollar lodging expense. They are a useful starting point for understanding where activity is concentrated, how it is changing and where expense pressure is highest.
The strategic question is not simply which city ranks first. It is where your organization has repeatable demand that can translate into better availability, stronger traveler adoption and a more effective hotel program.
Volume is not supplier leverage
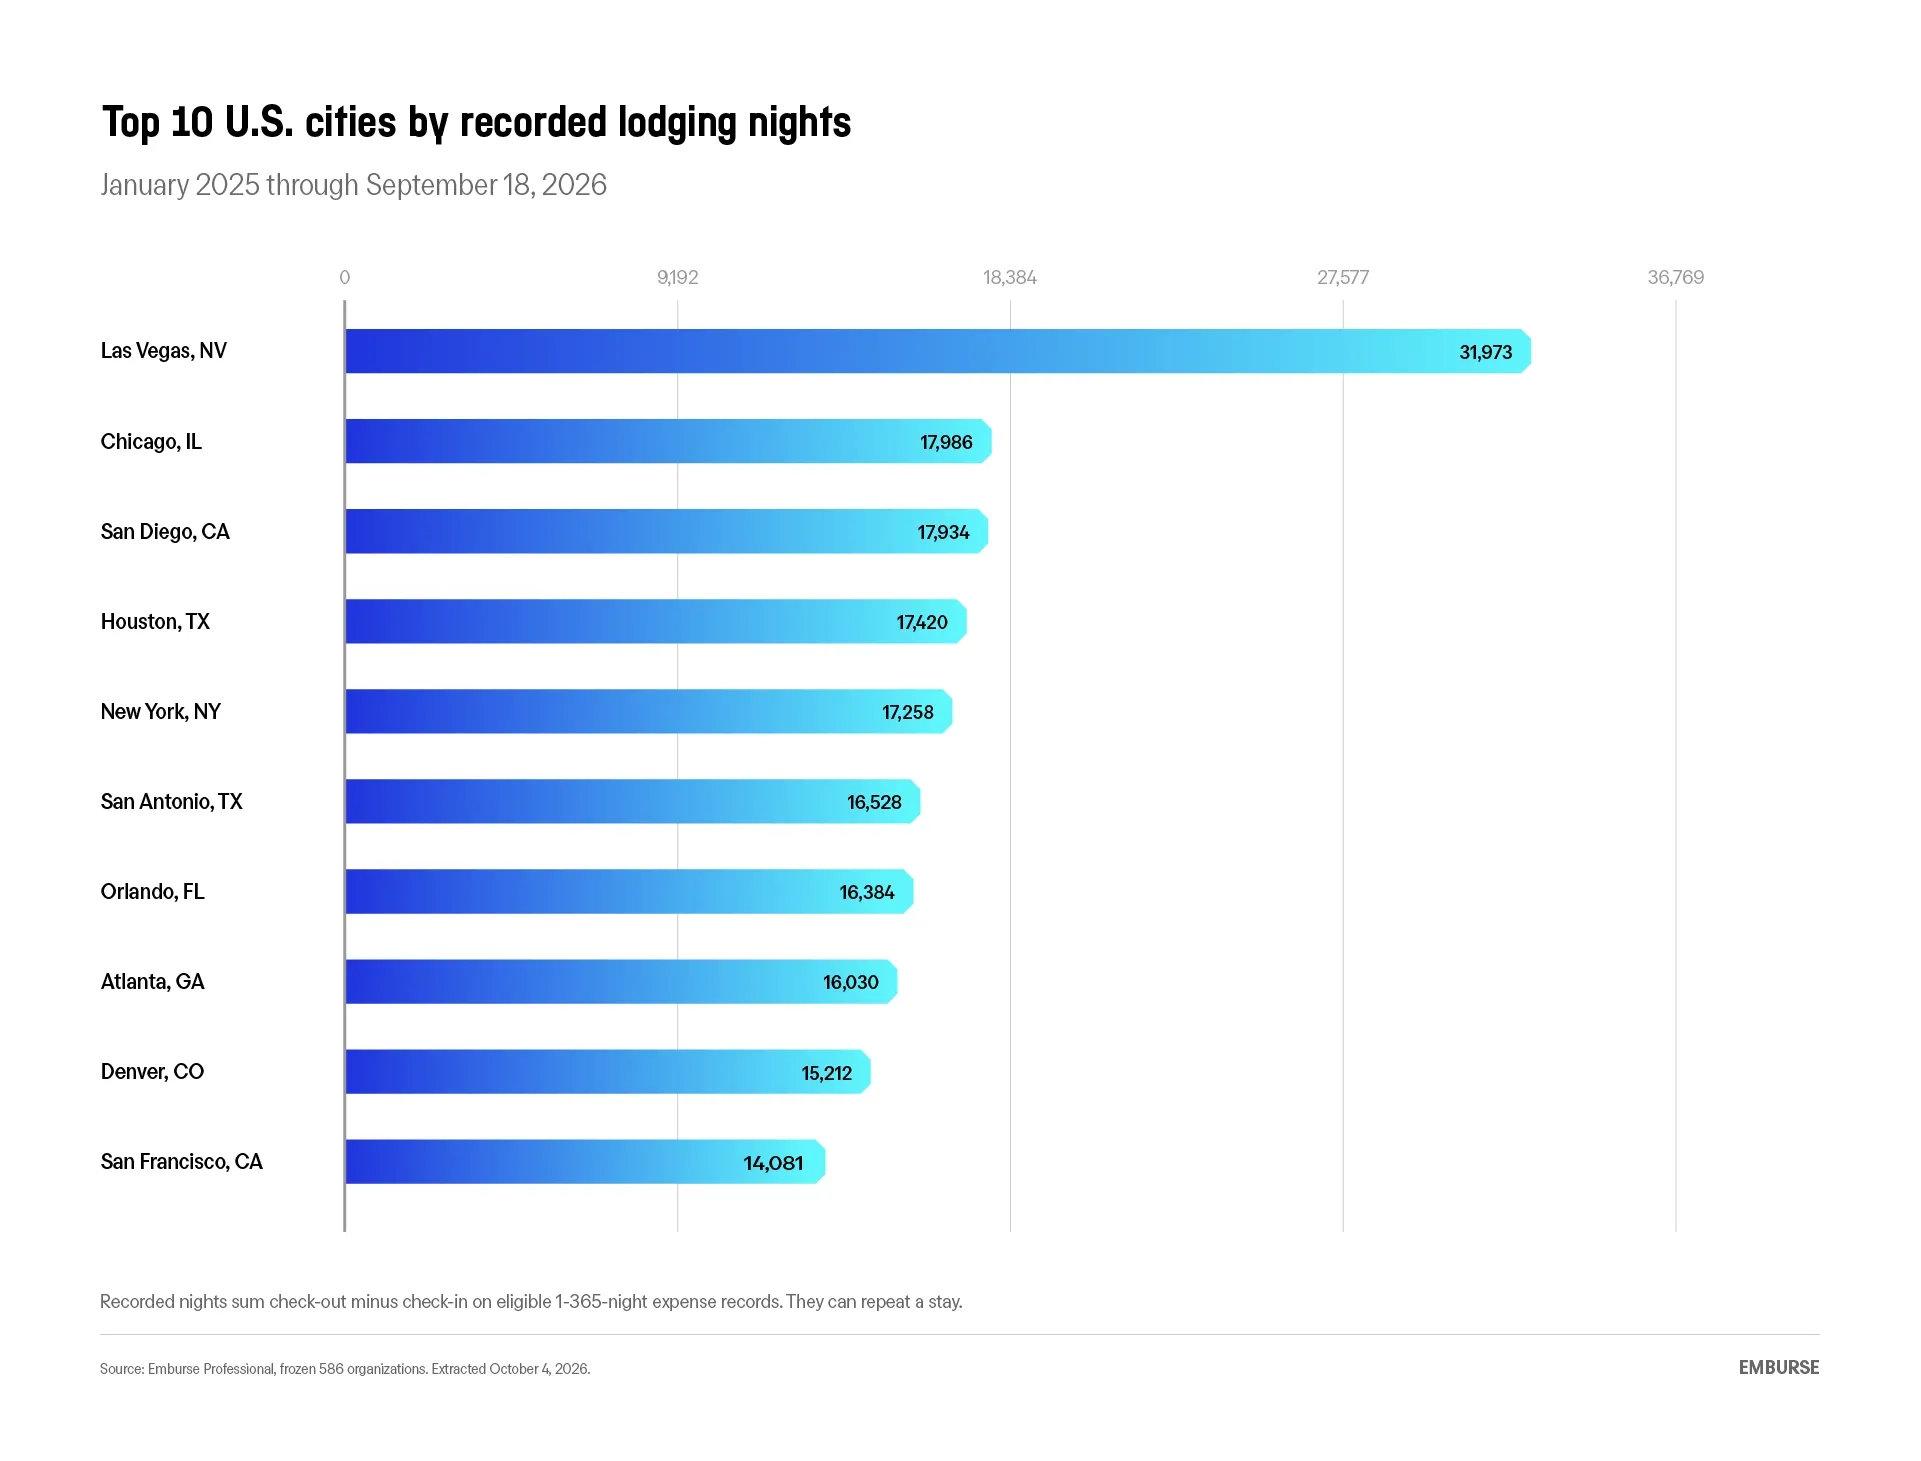
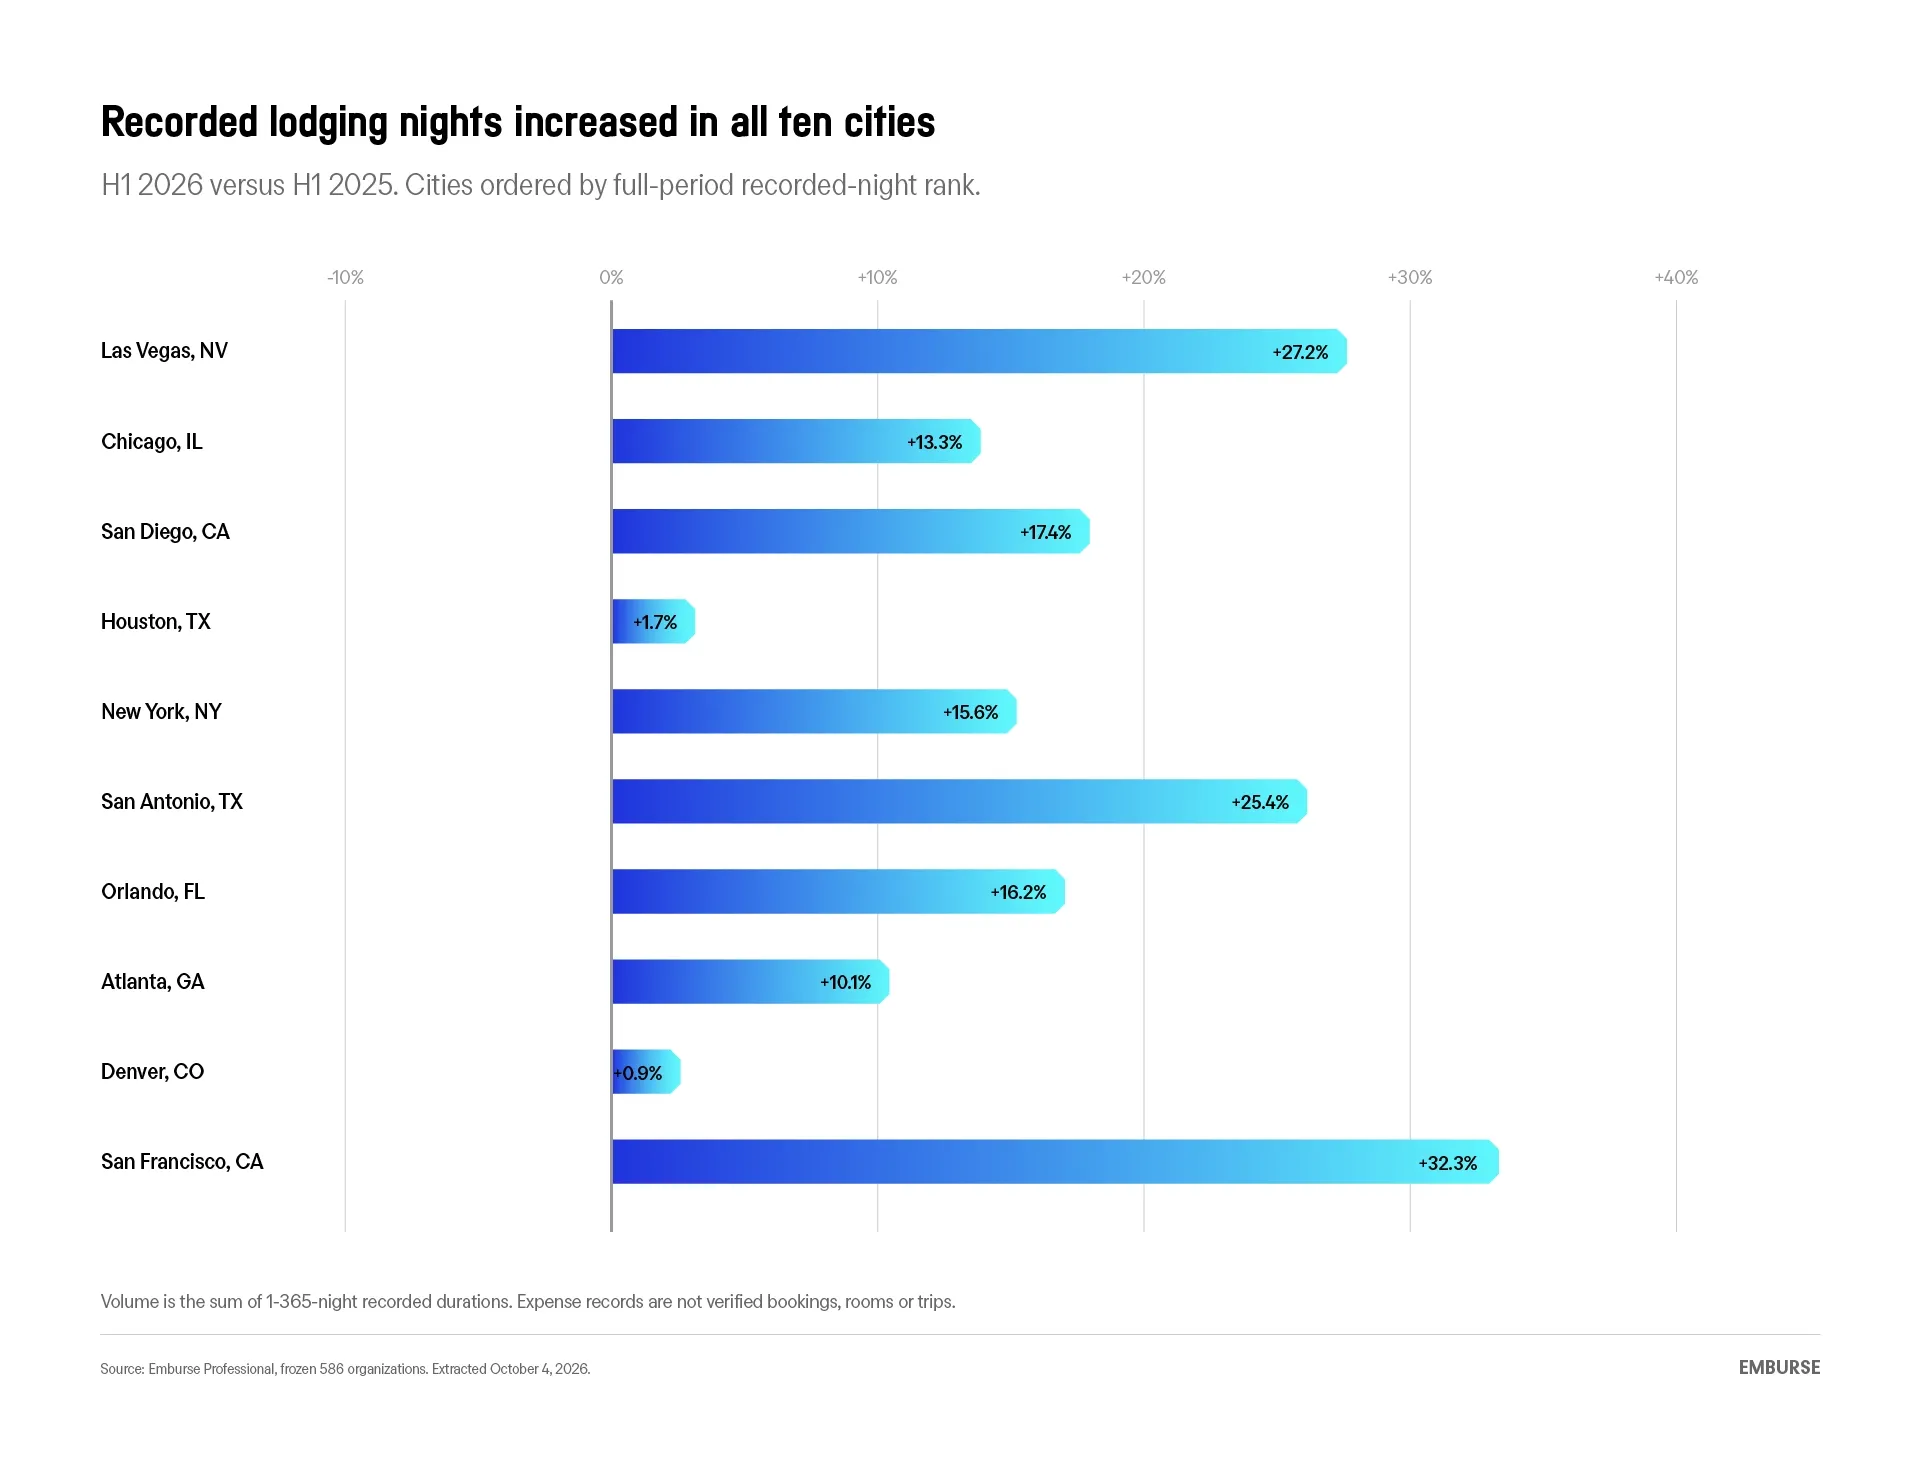
Las Vegas grew 27.2% in H1. Chicago recorded 17,986 lodging nights and grew 13.3%. Those are meaningful signals, but they do not become a negotiating position until an organization can show a hotel supplier where, when and how consistently that demand occurs.
A supplier does not need a company to have a large number of nights somewhere in a city. It needs a credible picture of recurring demand at properties or in neighborhoods it can serve.
That is the difference between a volume statistic and a demand story.
For procurement leaders, total volume should determine where to investigate, not where to assume a deal is warranted. The next questions are more specific: When do employees travel? How often do they return? Which locations matter? What length of stay is typical? What would make a preferred program practical enough for employees to use?
Rate is only one part of that conversation. A preferred property that is unavailable when employees need it, poorly located for the trip or paired with terms that do not fit the traveler experience will not deliver its promised value. A negotiated rate that sits unused is not a sourcing win.
The most effective hotel programs concentrate supplier attention where the organization can credibly bring recurring demand and rely on sensible policy and managed booking where they cannot.
Growth can be real and still not change your strategy
The fastest H1 growth rate among the top 10 cities came from San Francisco, where recorded lodging nights rose 32.3%. San Antonio followed at 25.4%, and Las Vegas grew 27.2%.
Those markets deserve attention, especially for organizations seeing similar movement in their own programs. But growth is a signal to investigate, not a decision to make.
San Francisco ranked tenth in the full-period list, and its inclusion in the top 10 is sensitive to longer recorded durations. San Diego’s recorded lodging nights rose 17.4% in H1, but one organization accounted for 31.4% of the city’s nights. Removing that organization changes the growth result to a 3.5% decline.
The original headline remains accurate. What changes is the “so what?”
An aggregate number can tell a travel team where to look. It cannot establish a durable market shift, prove that an individual company has supplier leverage or justify a major sourcing commitment. Before acting, leaders should test the signal against their own travel calendar, booking behavior and business plans.
High lodging cost is not automatically a policy problem
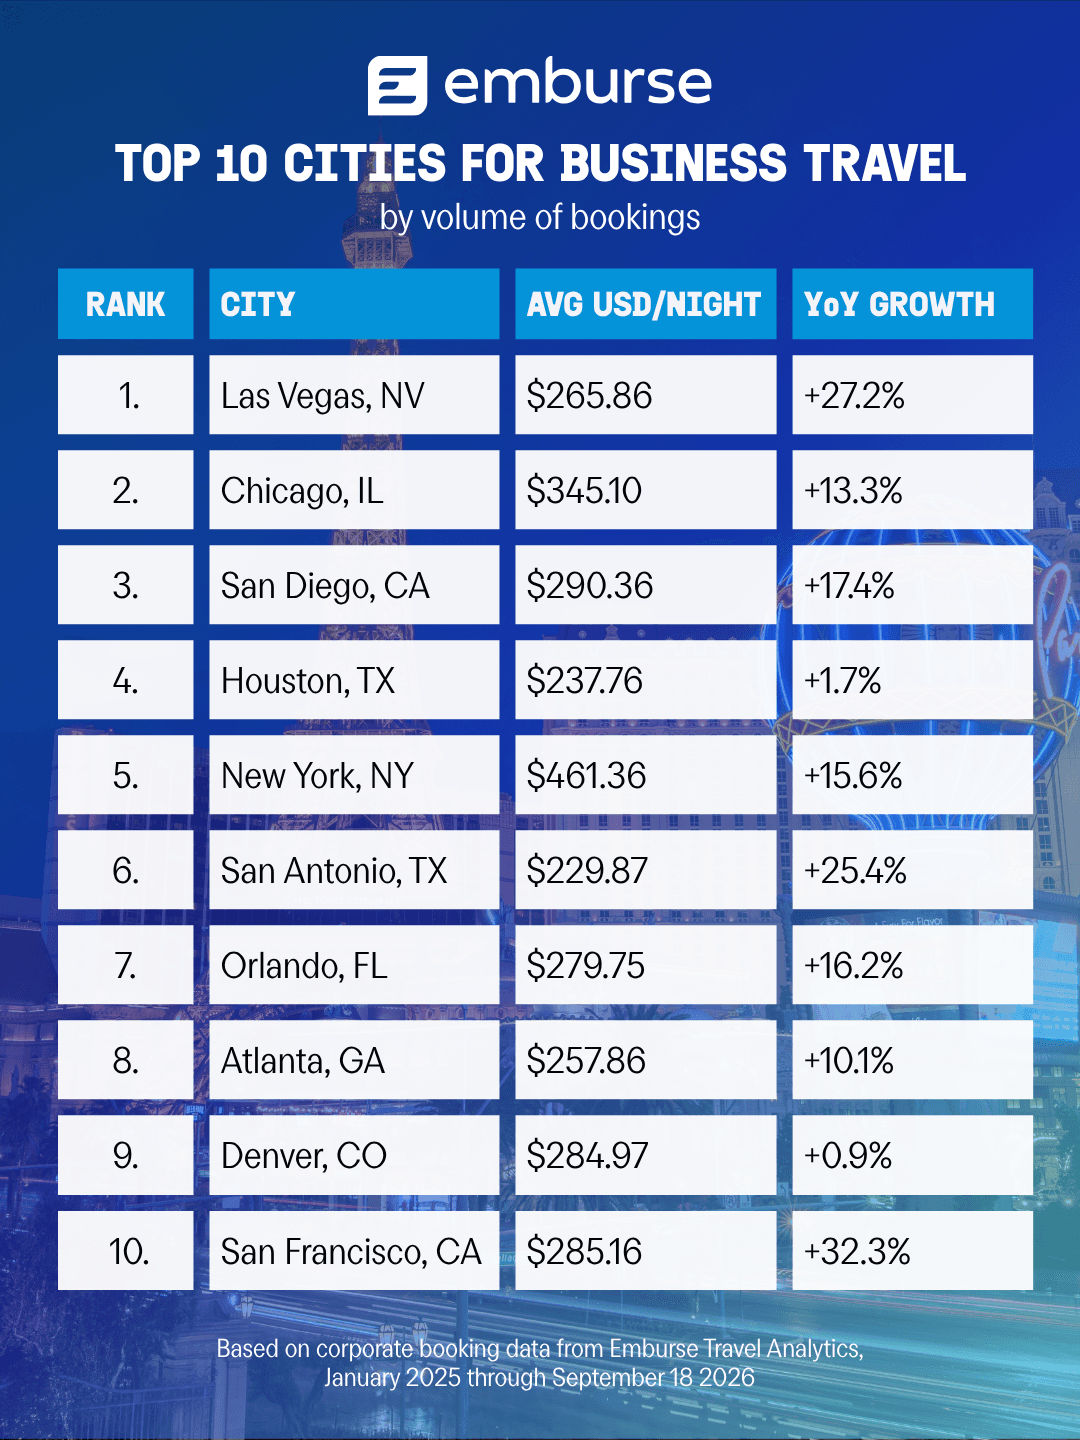
New York illustrates why city-level data needs to be interpreted rather than reacted to. It ranked fifth by volume, with 17,258 recorded lodging nights and 15.6% H1 growth, while posting the group’s highest weighted lodging expense at $461.36 per night.
The convenient response would be to lower a cap or tighten policy. That may also be the wrong response.
A high nightly expense can reflect availability, location, trip length, traveler mix or the properties employees can realistically use. The right question is not simply, “How do we spend less in New York?” It is, “What is driving cost in New York, and which change would improve the outcome?”
The same distinction appears across the top 10. Weighted lodging expense ranged from $229.87 per recorded night in San Antonio to $461.36 in New York. Houston, fourth by volume, had a weighted expense of $237.76 and just 1.7% H1 growth. Orlando combined 16.2% growth with a $279.75 weighted expense. Denver grew only 0.9%.
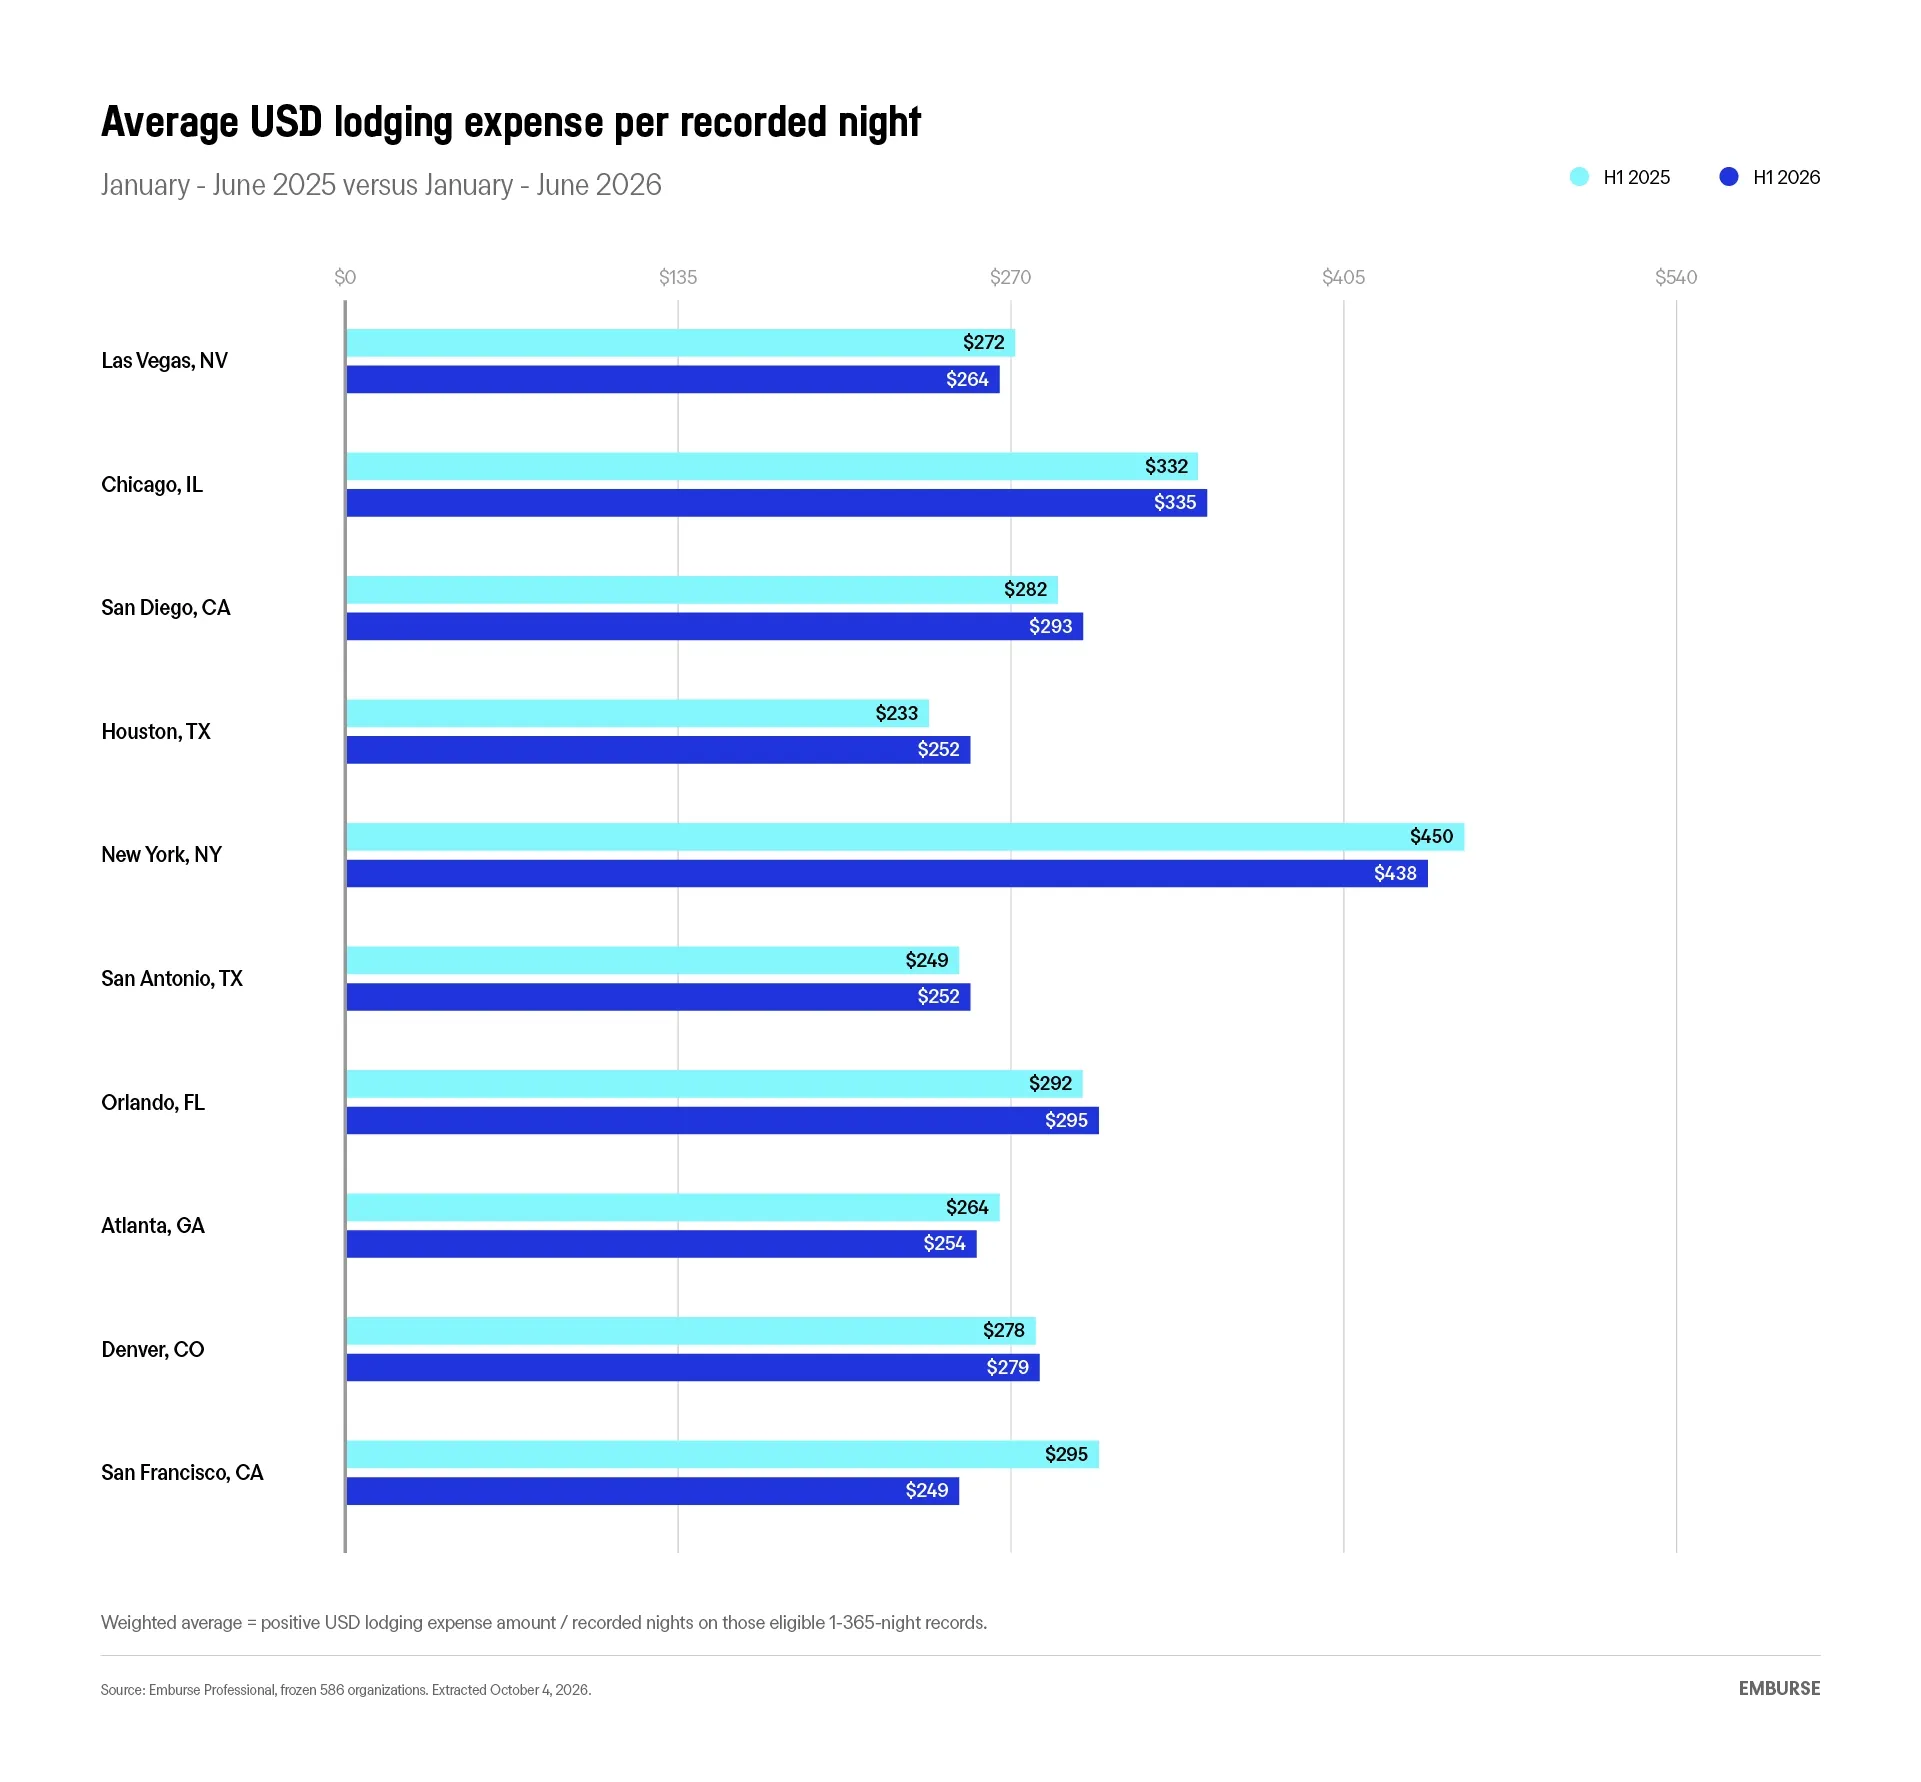
Volume, growth and cost do not move together in a uniform way. Finance teams should separate higher travel activity from higher nightly expense, then determine whether longer stays, availability constraints, traveler behavior or policy design are driving the budget pressure.
A blanket control may be easy to implement. A city-specific approach is more likely to work.
Key questions before hotel RFP season
The value of this data is not that it identifies a universal list of cities to prioritize. Its value is that it challenges travel, procurement and finance leaders to build their own demand story before they begin negotiating.
Before an RFP reaches suppliers, teams should be able to answer:
- Where do we have repeatable demand in locations suppliers can serve?
- What is changing beneath the total spend: lodging nights, length of stay, nightly expense or market mix?
- Which supplier terms would improve the program; not just the rate, but availability, location, cancellation flexibility and extended-stay options?
- Where would a stronger policy or managed-booking approach deliver more value than another negotiated agreement?
The industry benchmark provides context. Your organization’s own data shows what needs to change.
Approach hotel RFP season with more than a ranking. Go in with a clear view of where your demand repeats, what is shifting beneath it and what a better hotel program would enable.
That is not just a better sourcing conversation. It is a smarter strategy.
Methodology: Emburse analyzed a fixed cohort of 586 Emburse Professional customer organizations. Ranking is based on qualifying recorded lodging nights from January 1, 2025 through September 18, 2026. H1 growth compares January–June 2026 with January–June 2025. Figures are observed customer expense patterns, not representative estimates of the U.S. business travel market.