


The October 2026 edition of the Emburse AI Index uses a reviewed historical snapshot to explain why Finance teams need regional AI budget assumptions: spending levels and year-over-year growth differed across the customers observed. AI spend per eligible customer was highest in the United States at $6,014, compared with $3,490 in Europe and $2,971 in Canada. Year over year, the United States declined 2.9%, while Europe grew 20.0% and Canada grew 24.1%, using the same eligible-customer definition. The source note below identifies the measurement periods.
For Finance, the finding changes two decisions: where to review existing commitments and where to test expansion budgets. The higher United States spend level makes material commitments a useful starting point for owner and renewal reviews. Faster growth in Europe and Canada calls for separate expansion scenarios, checked against planned purchases and later completed months. One blended growth assumption could hide both patterns. These observations inform budget questions; they do not establish future growth, the causes of the differences, or returns on AI investment.
Regional AI Spend per Eligible Customer
The source workbook reports $6,014 per eligible customer in the United States, $3,490 in Europe, and $2,971 in Canada. Figure 1 retains the working image labels “Primary Market” (United States) and “Secondary Market” (Canada); the chart image needs country-name labels before publication.
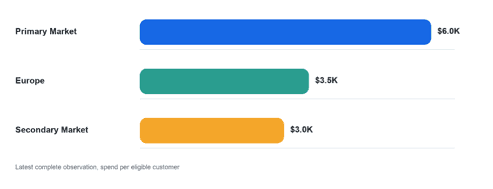
The highest observed spend level and the fastest growth rate point to different budget questions. The United States has the highest observed spend per eligible customer, making material AI commitments a useful starting point for review. Finance should check its own vendor, owner, and renewal records before deciding whether to retain, expand, or reduce those commitments. The regional average does not identify waste or justify an automatic budget cut.
Year-over-Year Regional AI Spend Growth
Year over year, AI spend per eligible customer rose 24.1% in Canada and 20.0% in Europe, while it fell 2.9% in the United States. Canada’s growth rate exceeded the United States rate by 27.0 percentage points. Each figure divides eligible-customer AI spend by the eligible customer count in that region and month; the eligible counts were unchanged across the two annual observations.
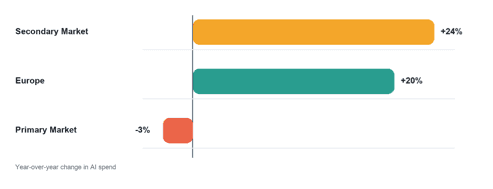
Europe and Canada grew faster from lower spend levels, so Finance should test what further expansion would require in each region rather than apply a common rate across all three. Pair each regional starting level with known commitments and alternative growth scenarios, then check later completed months. The year-over-year changes are observed comparisons, not next year’s forecast rates.
Six-Month Adoption Momentum
Adoption momentum is the six-month change, in percentage points, in the share of eligible customers counted as AI adopters under the Index rule. The change was +6.91 points in the United States, +5.82 in Canada, and +4.97 in Europe. A customer enters that share after AI spend of at least $1,000 in each of three consecutive months or a six-month average of at least $1,000 per month, and remains counted after first meeting the rule. The United States combined the largest adoption-share increase with a 2.9% decline in spend per eligible customer. The measures describe different behavior.
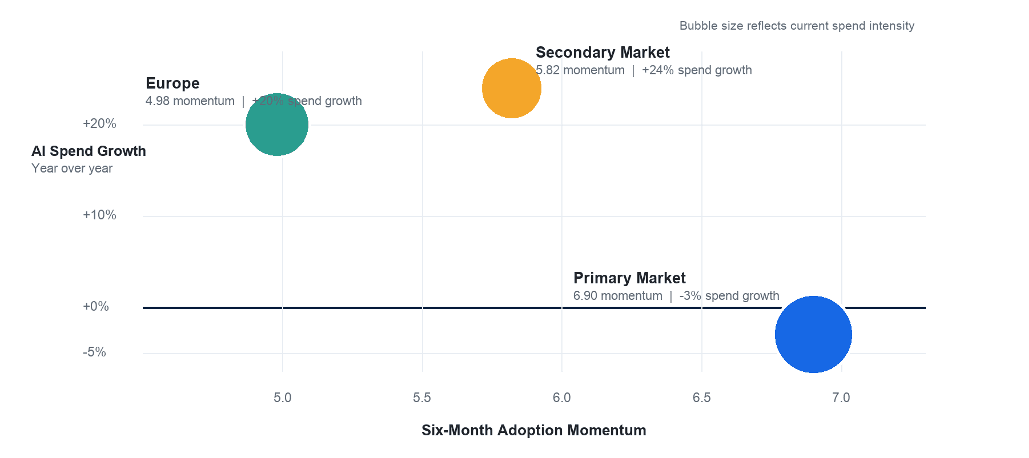
The United States illustrates why broader adoption does not automatically mean higher average spend: its adopted share rose 6.91 percentage points over the six-month observation window while spend per eligible customer fell 2.9% year over year. The periods and denominators differ, and adopters remain counted after first qualifying. Finance should track adoption breadth and spend intensity separately, then use current internal activity and commitment records to test what is driving its own budget. The Index does not establish active usage, savings, or the cause of the divergence.
Regional Forecast Inputs and Evidence Status
| Market | Observed Spend Level and Verified Changes | Forecast Treatment |
|---|---|---|
| United States | $6,014 per eligible customer; -2.9% year over year; adoption share +6.91 points over six months. | Use the observed spend level and verified annual decline as inputs; test whether the trend persists in later completed months. |
| Europe | $3,490 per eligible customer; +20.0% year over year; adoption share +4.97 points over six months. | Use the observed spend level and verified annual increase as inputs; check later completed months and available owner detail. |
| Canada | $2,971 per eligible customer; +24.1% year over year; adoption share +5.82 points over six months. | Use the observed spend level and verified annual increase as inputs; test expansion scenarios against later completed months. |
What Finance Teams Should Do Now
- Forecast regions separately. Start with each region’s observed spend level, add known commitments, and test alternative growth assumptions. Track adoption-share changes separately so broader adoption is not mistaken for an equivalent increase in spend.
- Test expansion budgets in Europe and Canada. Their faster year-over-year growth warrants a review of planned purchases, accountable owners, and approval capacity. Confirm later completed months and commitments before increasing the budget.
- Review material United States commitments. Use internal vendor and owner records to check renewal dates, continuing needs, and approved budgets. The higher regional spend level supports prioritizing review, while the annual decline alone does not support a consolidation or savings claim.
- Use available owner detail where the Emburse configuration supports it. Keep that operational analysis separate from the aggregated public AI Index measures.
The Operating Takeaway
The Finance takeaway is to budget and review AI commitments by region. The United States had the highest observed spend per eligible customer, while Canada and Europe had faster year-over-year growth from lower levels. Use that difference to prioritize commitment reviews and test regional expansion scenarios. Refresh those scenarios with later completed months and internal owner, vendor, and renewal evidence before changing budgets. Reported spend helps frame these decisions; it does not prove productivity or ROI.
The Emburse AI Index summarizes anonymized, aggregated AI-related spend. Emburse Expense Intelligence can help finance examine available AI-spend data across expense, invoice, and card workflows, depending on its Emburse configuration.
Frequently Asked Questions
How Should Finance Set Regional Assumptions
Start with each region’s observed spend per eligible customer and its verified year-over-year change. Test growth assumptions against later completed months and known commitments.
Why Use Spend per Eligible Customer
It divides observed AI spend by eligible customers in the same region and month. The spend levels compare intensity; comparing the same measure with the corresponding prior-year month shows regional growth.
How Can Emburse Help
The AI Index provides aggregated AI-related spend patterns. Depending on its Emburse configuration, Expense Intelligence can help finance examine available spend detail across expense, invoice, and card workflows.